
R is the leading open-source analytics tool for data modelling and statistics. Higher capacity to manipulate big data and visualize in different forms, R has exceeded SAS in terms of the capacity of data handling, performance, and outcome. Compatible in all platforms with a large number of packages for different types of data analysis, it also offers an easy to download as per user requirement. Web scraping is generally avoided as it is more cumbersome and time-consuming.
Tableau – pretty comprehensive and makes data visualization far easier compared to R. It has excellent flexibility when different datasets are in different formats. Most used for geospatial data, these create easily understandable maps very effectively.
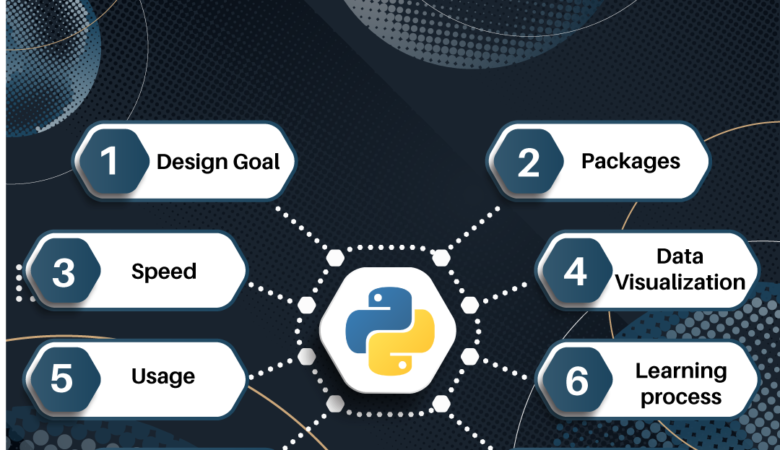
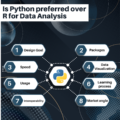
Python also is a very popular tool when it comes to data science. Python allows a more general approach to data science, while R and Tableau give a more statistical approach. It has similar functions as R – data engineering, data wrangling, web scraping. Unlike R, Python is widely used for Machine Learning.
Python codes have the added advantage of being more accessible from different platforms and are more robust and readable. These are the most effective singular tools, but we can also use different tools to do various tasks. You may use more than one tool for data mining since they are most effective in their respective fields.
SAS – Statistical Analysis Software.
It is accessible, manageable, and can analyze data from any sources. With SAS you can perform advanced analysis, Business Intelligence, Predictive Analysis, and data management. As a result, SAS helps to operate effectively in the competitive and changing business conditions with these features. It is used as a commercial software because it involves an investment. Very easy to learn with limited SQL skills, it is easy to train employees against R that requires a superior skill set. It is generally assumed to be the market leader for financial analytics.
Excel is a fundamental tool that is used by all data analysts regardless of the other tools that are used like SAS, R, Python, or Tableau. It is essential when there is a requirement of a basic analysis of the client’s data like pivot tables that helps structure out the framework for analysis. Majorly used for financial and business modelling, Excel also allows advanced business analytics.
These are the top 5 data analytical tools that are generally used in performing data mining right from collection of data, to filtering them and modelling them to result in meaningful insights. For someone who is looking out to venture in Data Analytics, starting with basic Excel, is a prerequisite. It ensures one generates a level of comfort with dealing data as well as understand the basics of modelling. It is a sunrise industry and has immense opportunities as one keeps skilling oneself.

Leave a Reply